Inequalities - data
Everyone has a right to have the highest attainable standard of physical and mental health. However we can see differences in people’s health and wellbeing across different groups.
These differences are influenced by the conditions in which people are born, live, and work e.g.:
- Childhood experiences
- Housing
- Education
- Social Support
- Family Income
- Employment
- Community
- Access to health services
People affected by poverty and social disadvantage have poorer health outcomes, are more likely to die younger and are more likely to suffer ill-health than their neighbours with more resources.
Some examples of differences seen in people's health according to areas of deprivation include:
- Early death due to coronary heart disease: 3.1 times more likely
- Emergency admissions (aged 65+): 1.4 times more likely
- Alcohol-related hospitalisations: 4.5 times more likely
- Prescription for anxiety/depression: 9.3% higher
(data is presented as the risk for those living in the most deprived areas (SIMD quintile 1) compared to those living in the least deprived areas (SIMD 5) Source: ScotPHO profiles, Public Health Scotland [Accessed August 2025)
Scottish Index of Multiple Deprivation
The Scottish Index of Multiple Deprivation 2020 identifies places experiencing deprivation, where:
- 7.7% of the Midlothian population is in the most deprived quintile (SIMD 1)
- One third of the Midlothian population is in the second most deprived quintile (SIMD 2)
- 14.1% of the Midlothian population is in the least deprived quintile (SIMD 5) (Compared to Edinburgh with 42.5 % of its population in the least deprived quintile)
Data source: National Records of Scotland 2025
There are 10 data zones in Midlothian within the most deprived 20% data zones in Scotland:
- 2 in the most deprived 5% - both in Dalkeith.
- 1 in the most deprived 5-10% - in Dalkeith
- 2 in the most deprived 10-15% - in Easthouses and Mayfield
- 5 in the most deprived 15-20% - in Straiton, Mayfield, Easthouses, North Gorebridge and Gorebridge & Middleton
SIMD Data Zone Quintiles by Geography
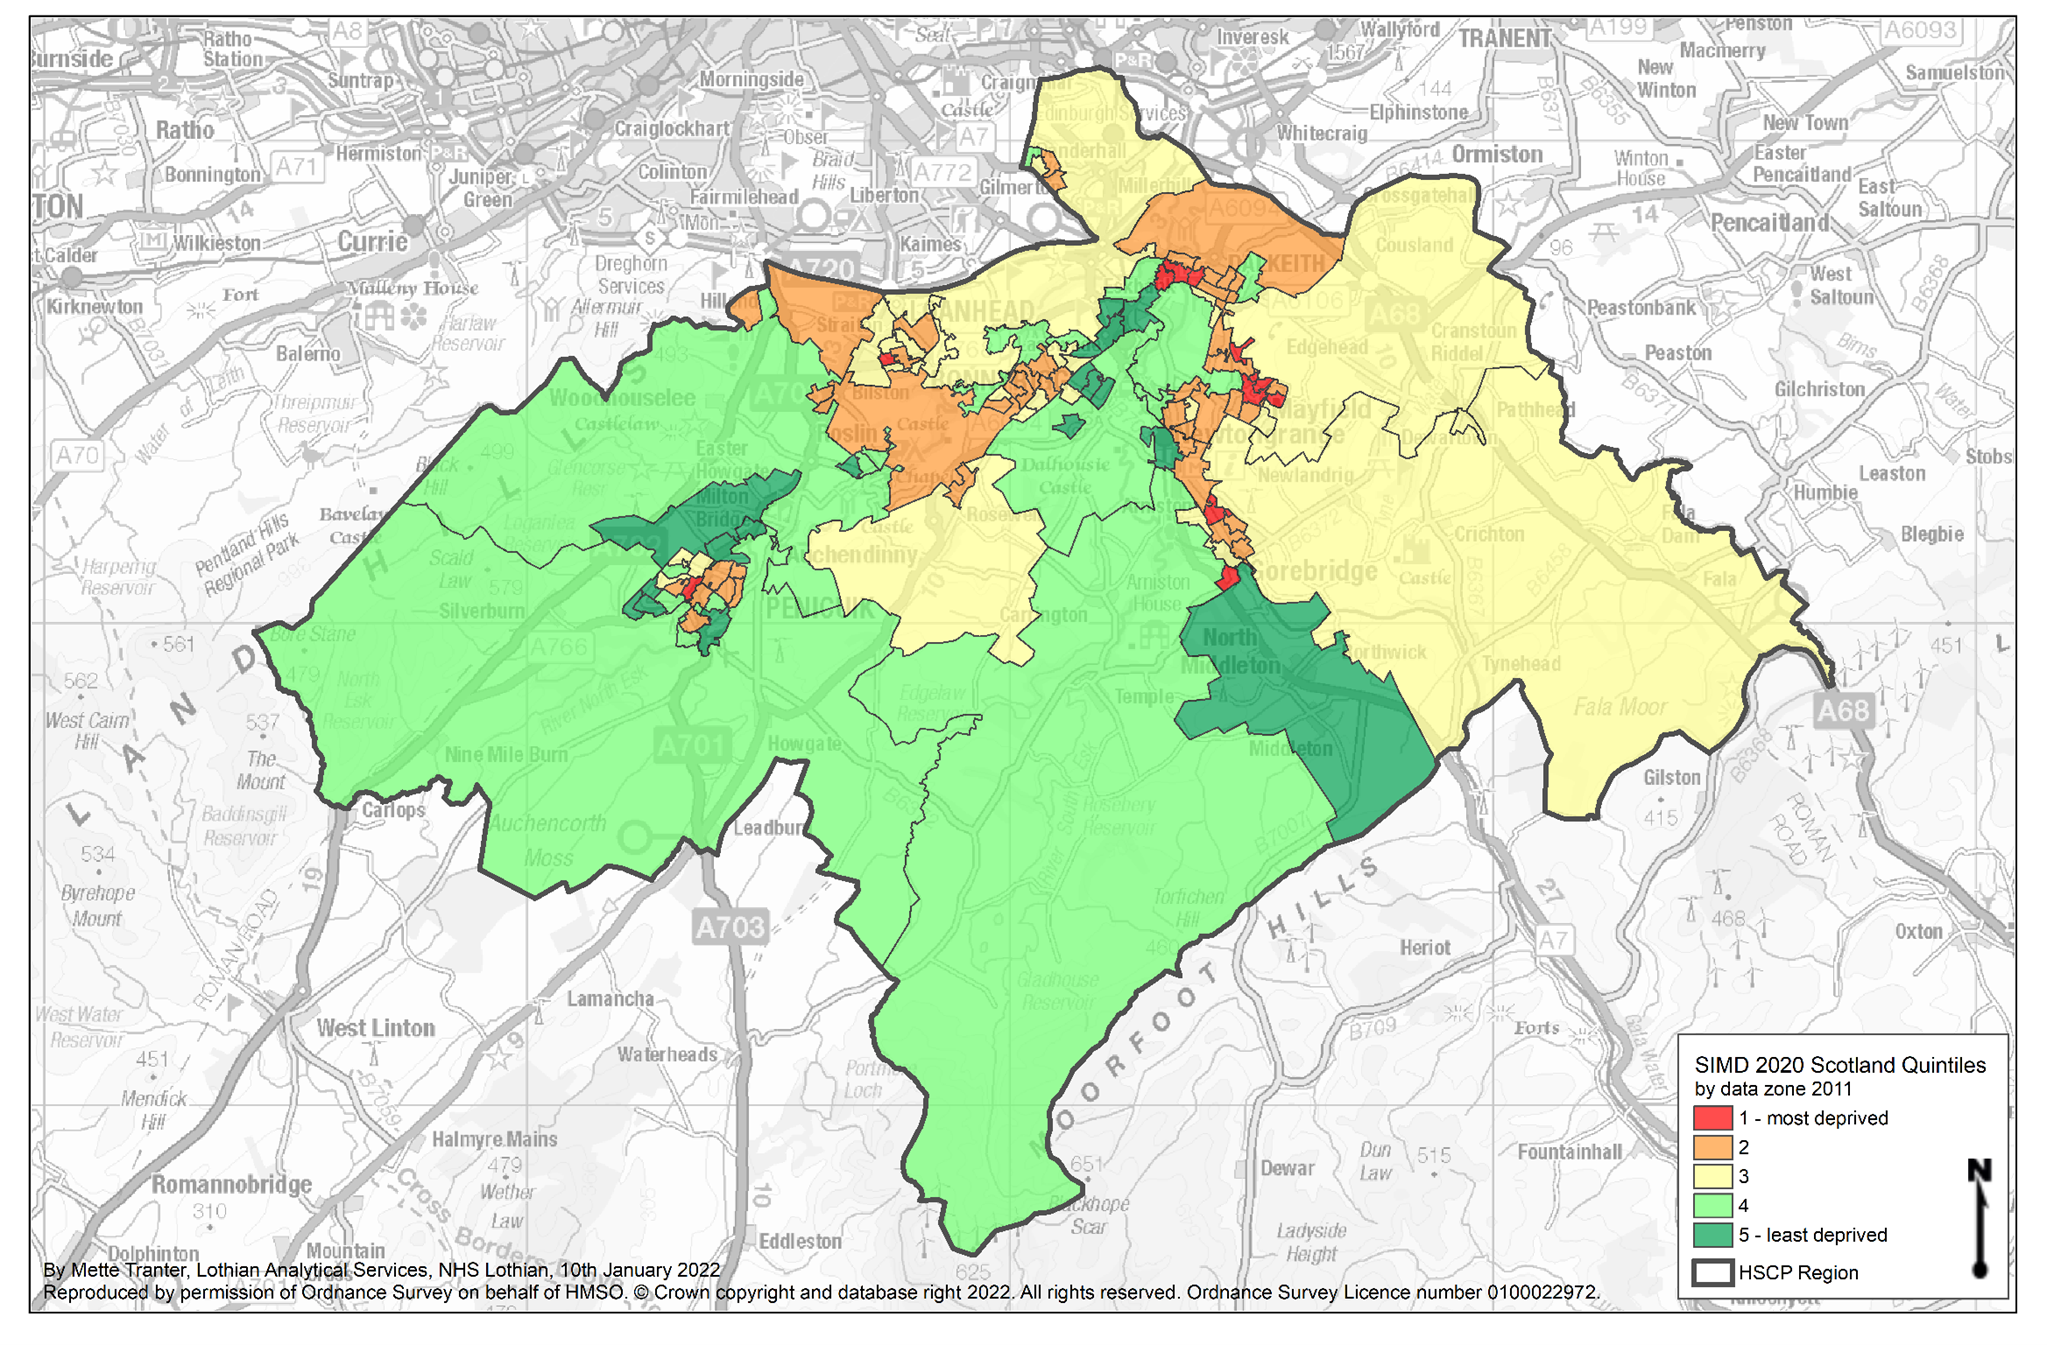
Whilst all areas in the most deprived 20% were around Dalkeith, Mayfield, Easthouses and Gorebridge, areas in the most deprived 20-30% were spread more widely including Thornybank, Penicuik and Newtongrange.
Digital Inclusion
Digital skills and confidence (as well as affordable and reliable access to digital devices and data) are becoming essential to life in the UK (Good Things Foundation, Carnegie Trust, 2020).
Some people do not have access to an affordable or reliable internet connection, an appropriate device, or the skills to engage with digital public services (Audit Scotland, 2021). Digital inequalities are strongly linked to wider social and economic disadvantage (Good Things Foundation, Carnegie Trust, 2020). There is a strong relationship between the Scottish Index of Multiple Deprivation and internet uptake in Scotland, with internet uptake among the 10% most deprived in Scotland at 53% compared to 81% for the 10% least deprived (Carnegie UK Trust, 2016a).
UK-level evidence (Honeyman etc al, 2020) involving narrow measures of access and use of digital technologies suggests that gaps in measures of digital technology use between disadvantaged groups and the rest of the population have been narrowing in recent years. However, significant differences in access and use persist:
- People living in rural areas have less access to, and slower, internet infrastructure. Recent data is lacking but deprived areas also were more likely to lack access.
- Older people are less likely to own smartphones or connect to the internet.
- Where differences between ethnic groups persist in internet access this is explained by the age and income profile of these groups.
- People with lower income are less likely to have access to smartphones in their household and be on pay monthly contracts and data plans.
In Midlothian:
- 97% of people in Midlothian report to have access to the internet at home.
- Computer, phone and tablet - top 3 devices used by adults who use the internet for personal use (Scottish Household Survey 2021)
Page updated: January 2026