Population - Data
Total Population
On 30 June 2023, the population of Midlothian was estimated as 98,260 (National Records of Scotland, 2023). This is an increase of 1.3% from 97,040 in 2022. Over the same period, the population of Scotland increased by 0.8%.
Projected Population
Population projections are estimates of the growth or decline in the number and characteristics of people living in an area. They consider things like the local birth rate and how many people are coming to live in the area or leaving it each year.
Midlothian is projected to have the 22nd highest population out of the 32 council areas in Scotland in 2028.
Total projected population (%) Midlothian and Scotland, 2018-2029
Source: National Records of Scotland
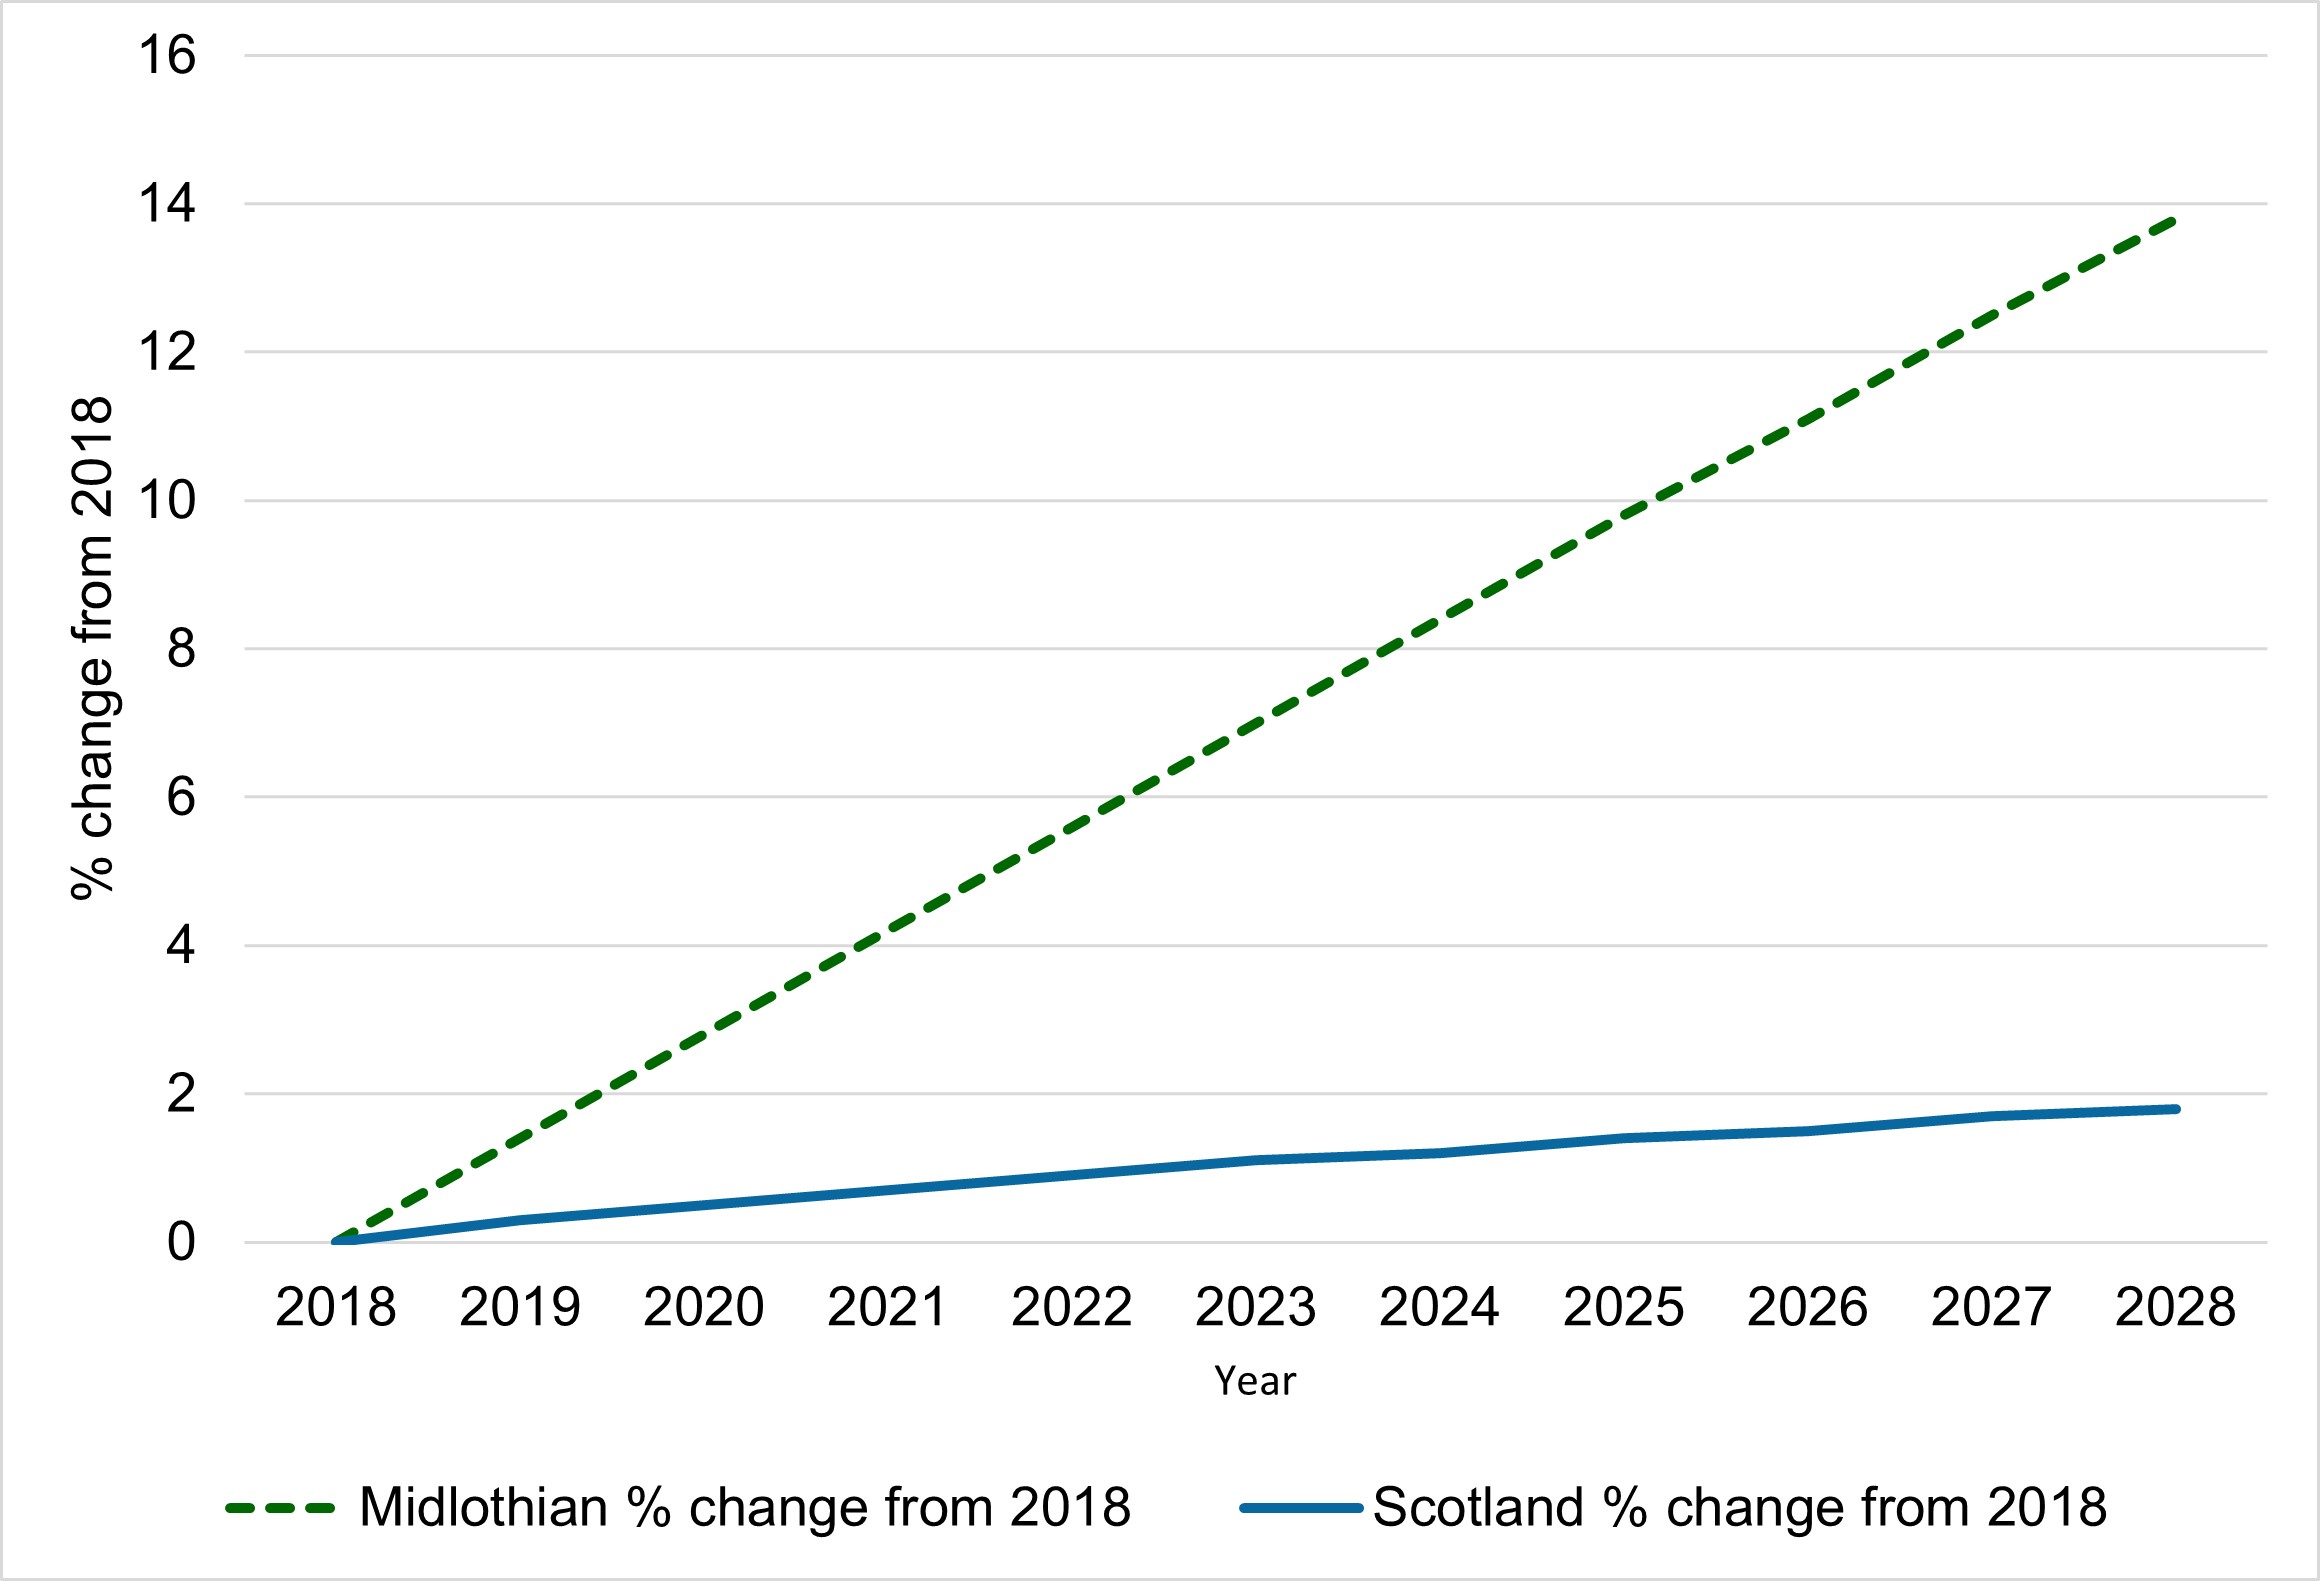
All estimates are based on making assumptions about future migration and birth rates. There is reason to believe that the National Records of Scotland estimates of future population growth are too low as they do not consider the Scottish Government’s Minimum All Tenure Housing Land Requirement for Midlothian. National Planning Framework 4 places an expectation that the Minimum All Tenure Housing Land Requirement will allocate housing land for a minimum of 8,850 new homes in Midlothian for its 10-year lifespan of 2026-2036. Based on this housing expectation, and making certain assumptions about the number of people who will live in new builds, the 2023 to 2036 population increase could potentially be 27%, from 98,600 to 125,300 people (Midlothian Council, 2023) compared to the National Records of Scotland estimate of 15.1% from 2018 to 2029.
Age
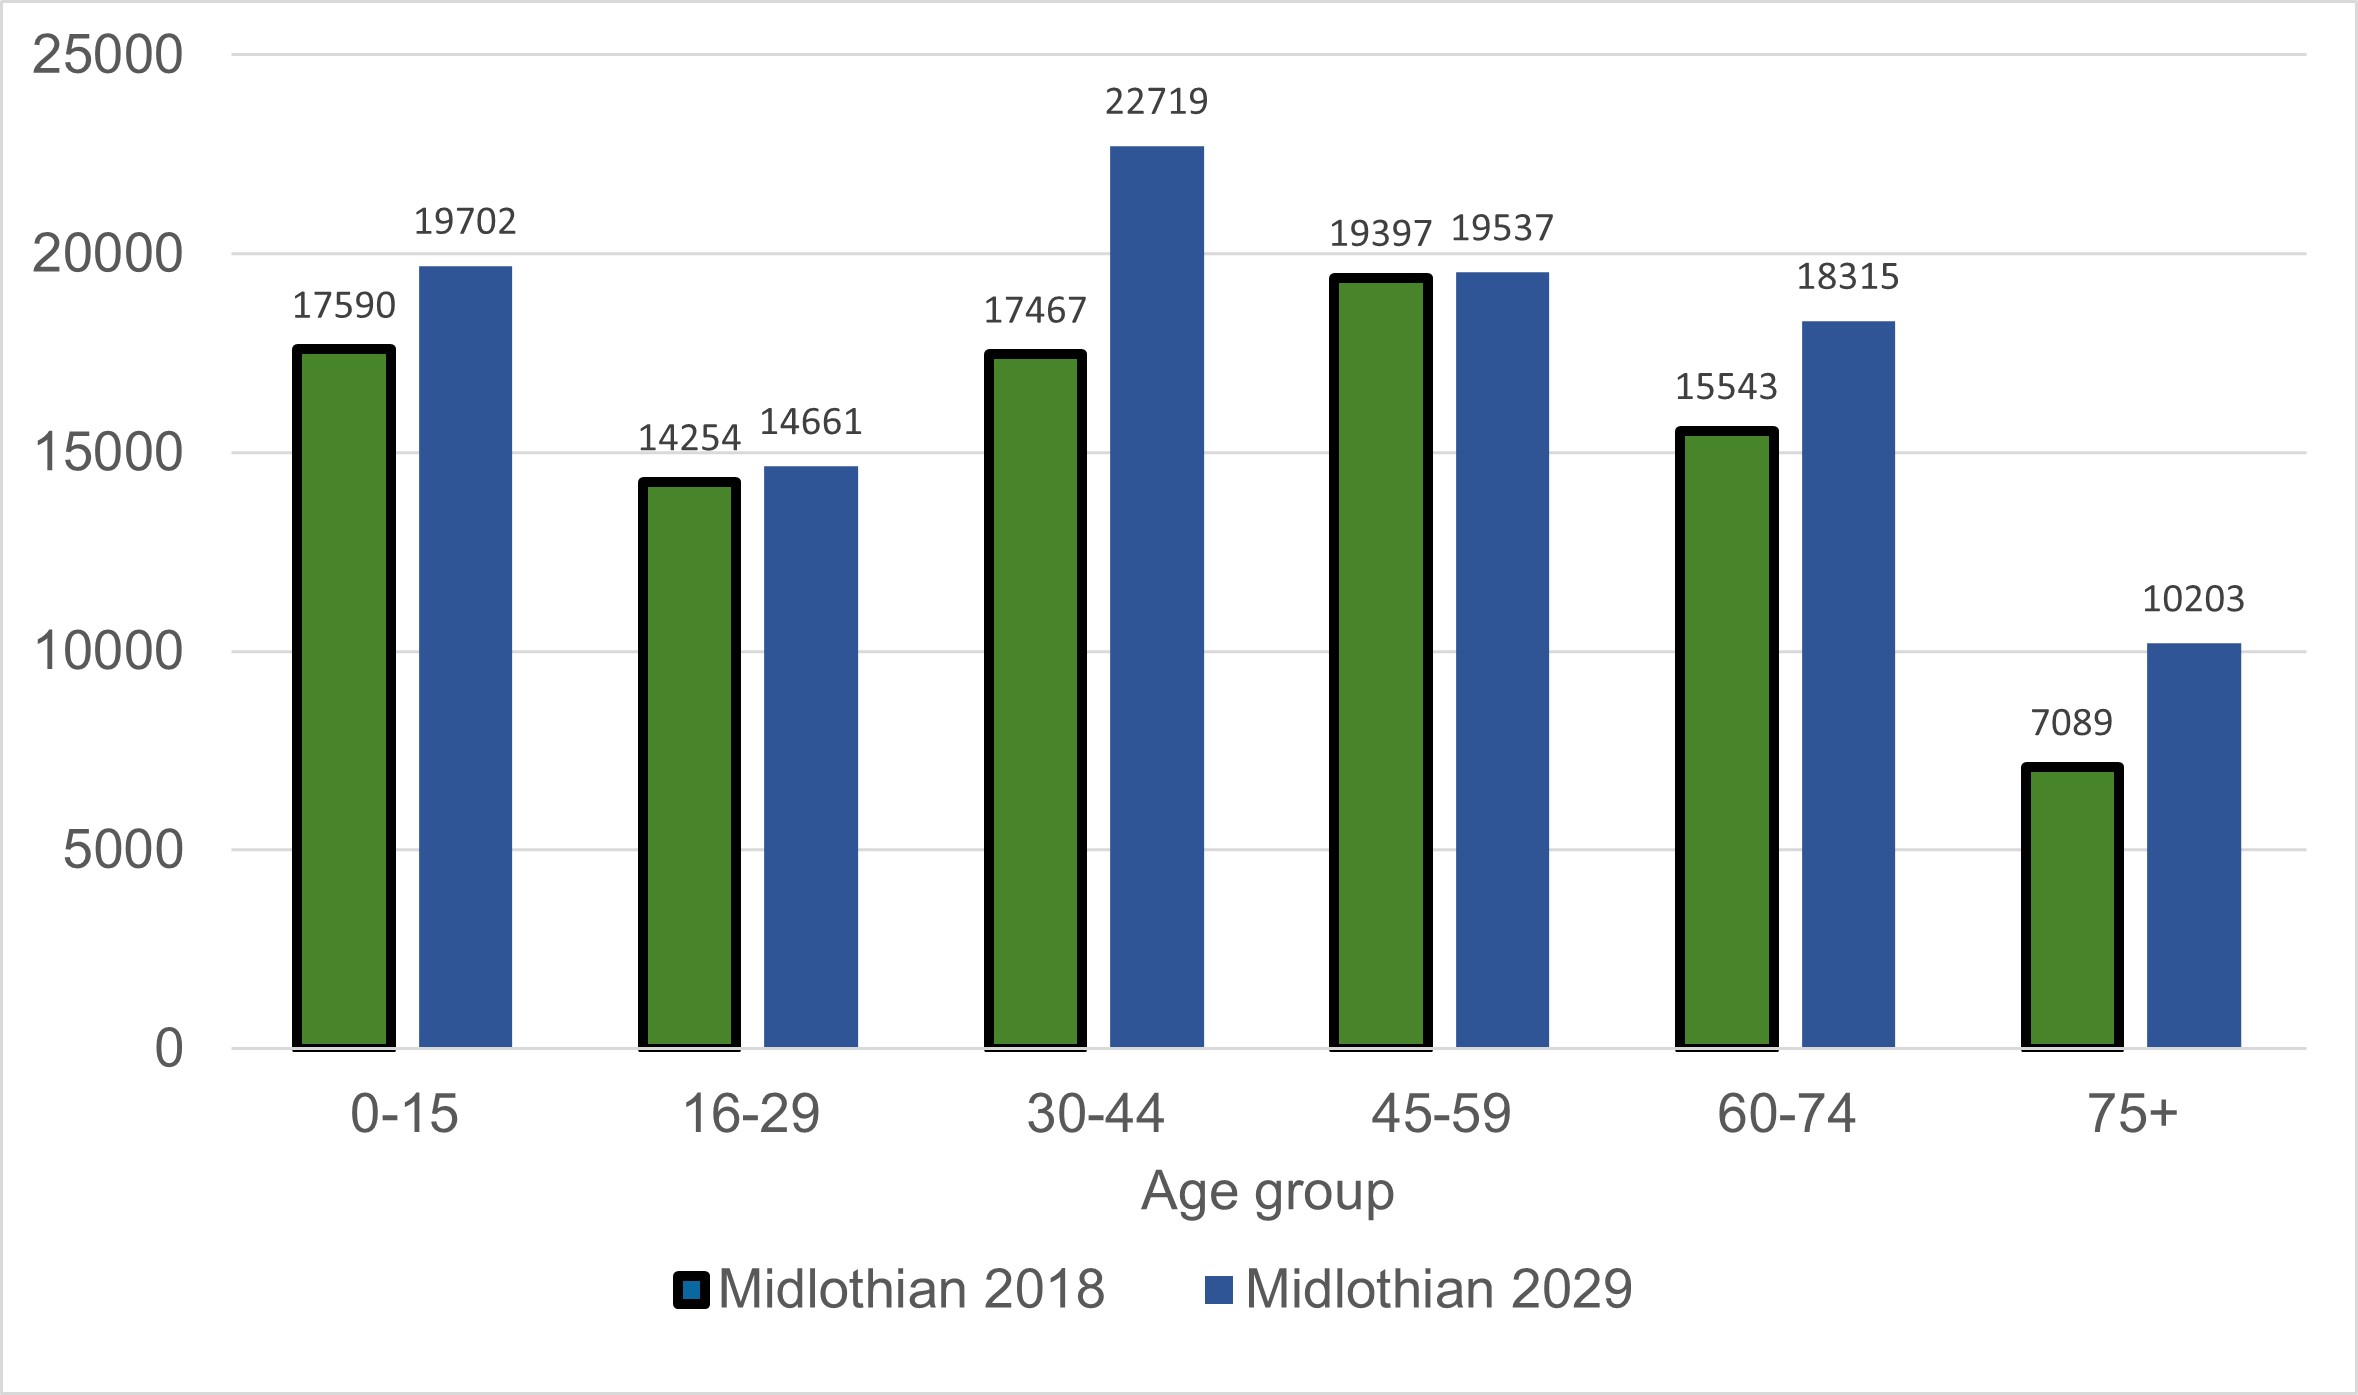
Between 2018 and 2029, each age group increased in size (National Records of Scotland, 2023). The largest absolute increase is expected in the 30-44 age group, which is projected to overtake the 45-59 group and become the largest of the 15-year age groups. The largest proportional increase is expected in the 75+ age group (+44%).
Midlothian Population in 2018 and the projection for 2029 by age group
Data source; Scotland Census
Sex
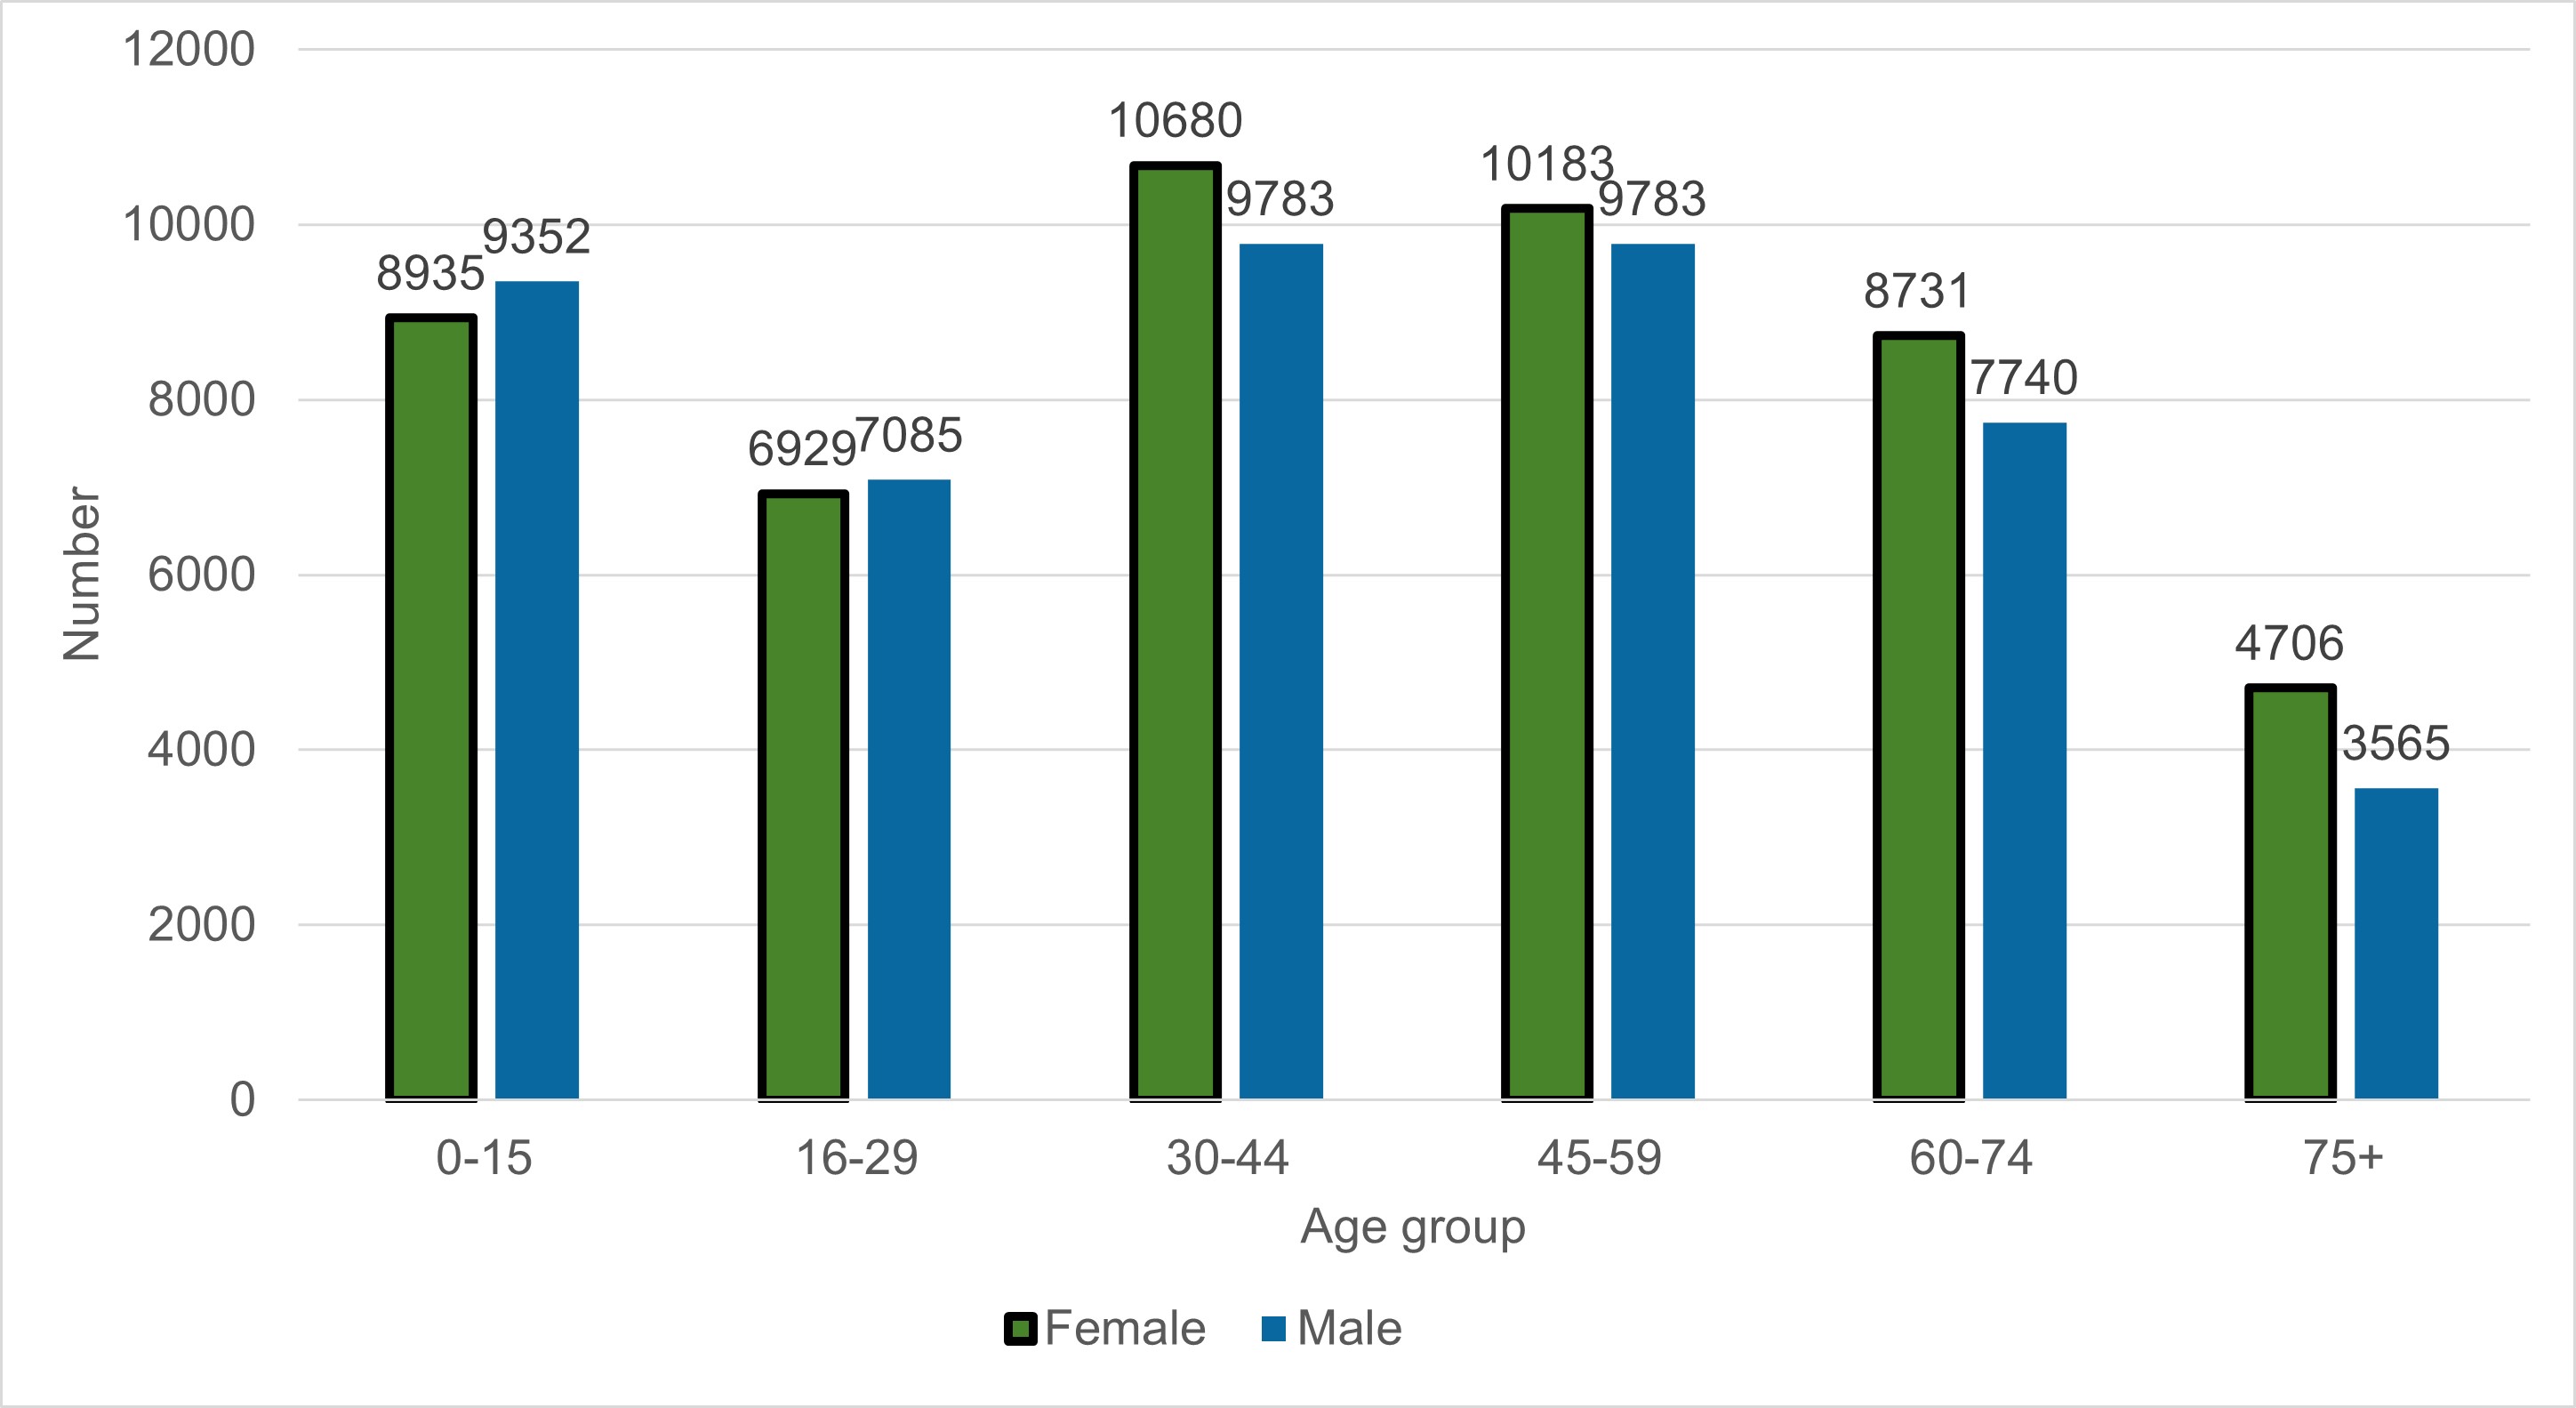
The female proportion of the population increases with age. This has implications for pensioner poverty as, historically, women have smaller retirement pensions.
Population of Midlothian by Age and Gender (2024)
Data source: National Records of Scotland
Gender identities
Historically, reliable local figures for Trans and other gender identities (Scottish Government, 2022) have not been available. Scotland’s Census included a question on gender identity for the first time in 2022. This was a voluntary question for people aged 16 and over.
Results from the 2022 census show that 0.29% of people in Midlothian identify as trans or have a trans history, compared to 0.44% of people in Scotland as a whole (Scotland’s Census 2022).
Sexual orientation
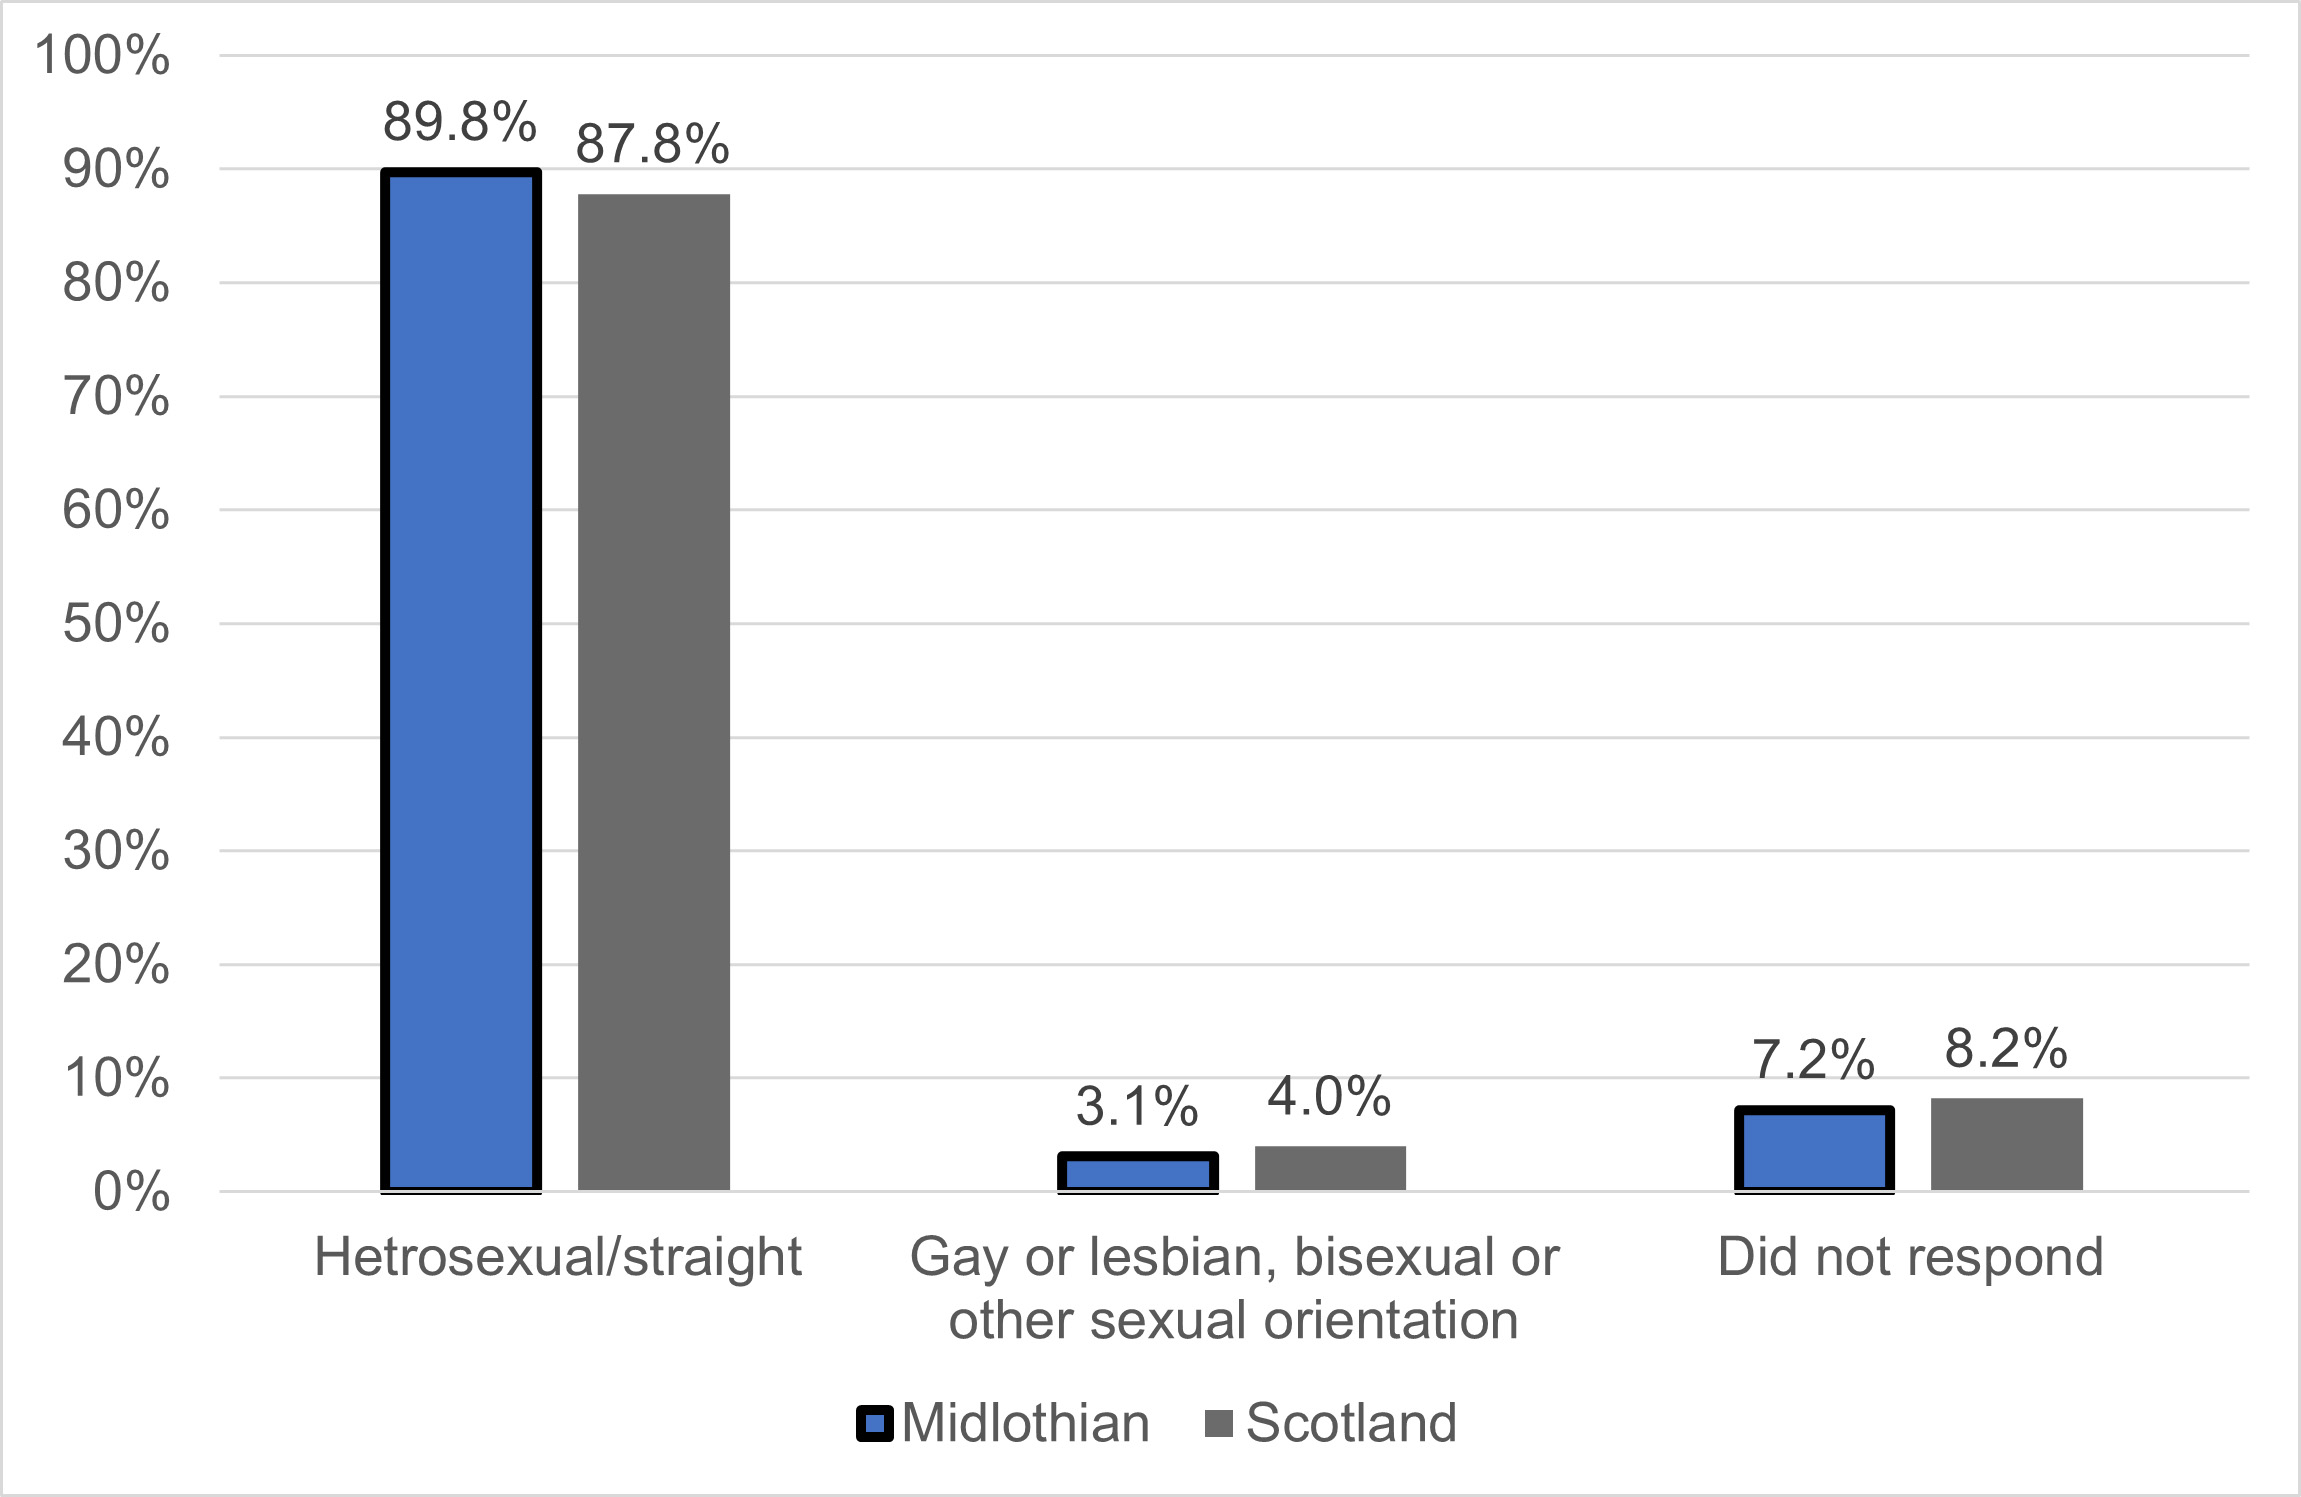
Historically, reliable local figures for sexual orientation have not been available. Scotland’s Census included a question on sexual orientation for the first time in 2022. This was a voluntary question for people aged 16 and over.
Percentage of the population of each sexual orientation in Midlothian in 2022
Scotland Census 2022
Ethnicity
Scotland’s Census in 2022 asked people to choose the option that best described their ethnic group or background. The majority of people in Scotland chose ‘White Scottish’ (77.7%) or ‘White Other British’ (9.4%). In 2022 these groups together made up 87.1% of the population. The percentage of people in Scotland with a minority ethnic background increased from 8.2% in 2011 to 12.9% in 2022. In Midlothian 82.4% chose ‘White Scottish’, 7.8% ‘White Other British’ and 9.8% chose ‘minority ethnic group’ in 2022. ‘Minority ethnic group’ is used here to refer to all other ethnic groups. This includes some ethnic groups that were in the White category on the census form such as Irish, Polish, Gypsy/Traveller, Roma and Showman/Showwoman.
Religion or Belief
In Scotland in 2022, 51.1% of people had no religion, 20.4% responded ‘Church of Scotland’, the next largest religious groups were ‘Roman Catholic’ (13.3%), ‘Other Christian’ (5.1%) and ‘Muslim’ (2.2%).
60% of Lothian’s adult population said they had no religion, an increase from 47% in 2011. All four local authorities had higher proportions of the population responding that they had no religion compared with Scotland. Midlothian had the highest percentage of non-religious people (64%).
Marriage and Civil Partnership
Marriages have declined in Midlothian, from 701 in 2005 to 319 in 2021.
Civil Partnerships have also declined since their introduction in 2005, averaging 5 per year from 2006-2014 and recording 5 in total from 2015-2021 (National Records of Scotland, 2023).
Pregnancy and maternity
Births per 1,000 population for Midlothian and Scotland from 1991-2021
Data source: National Records of Scotland
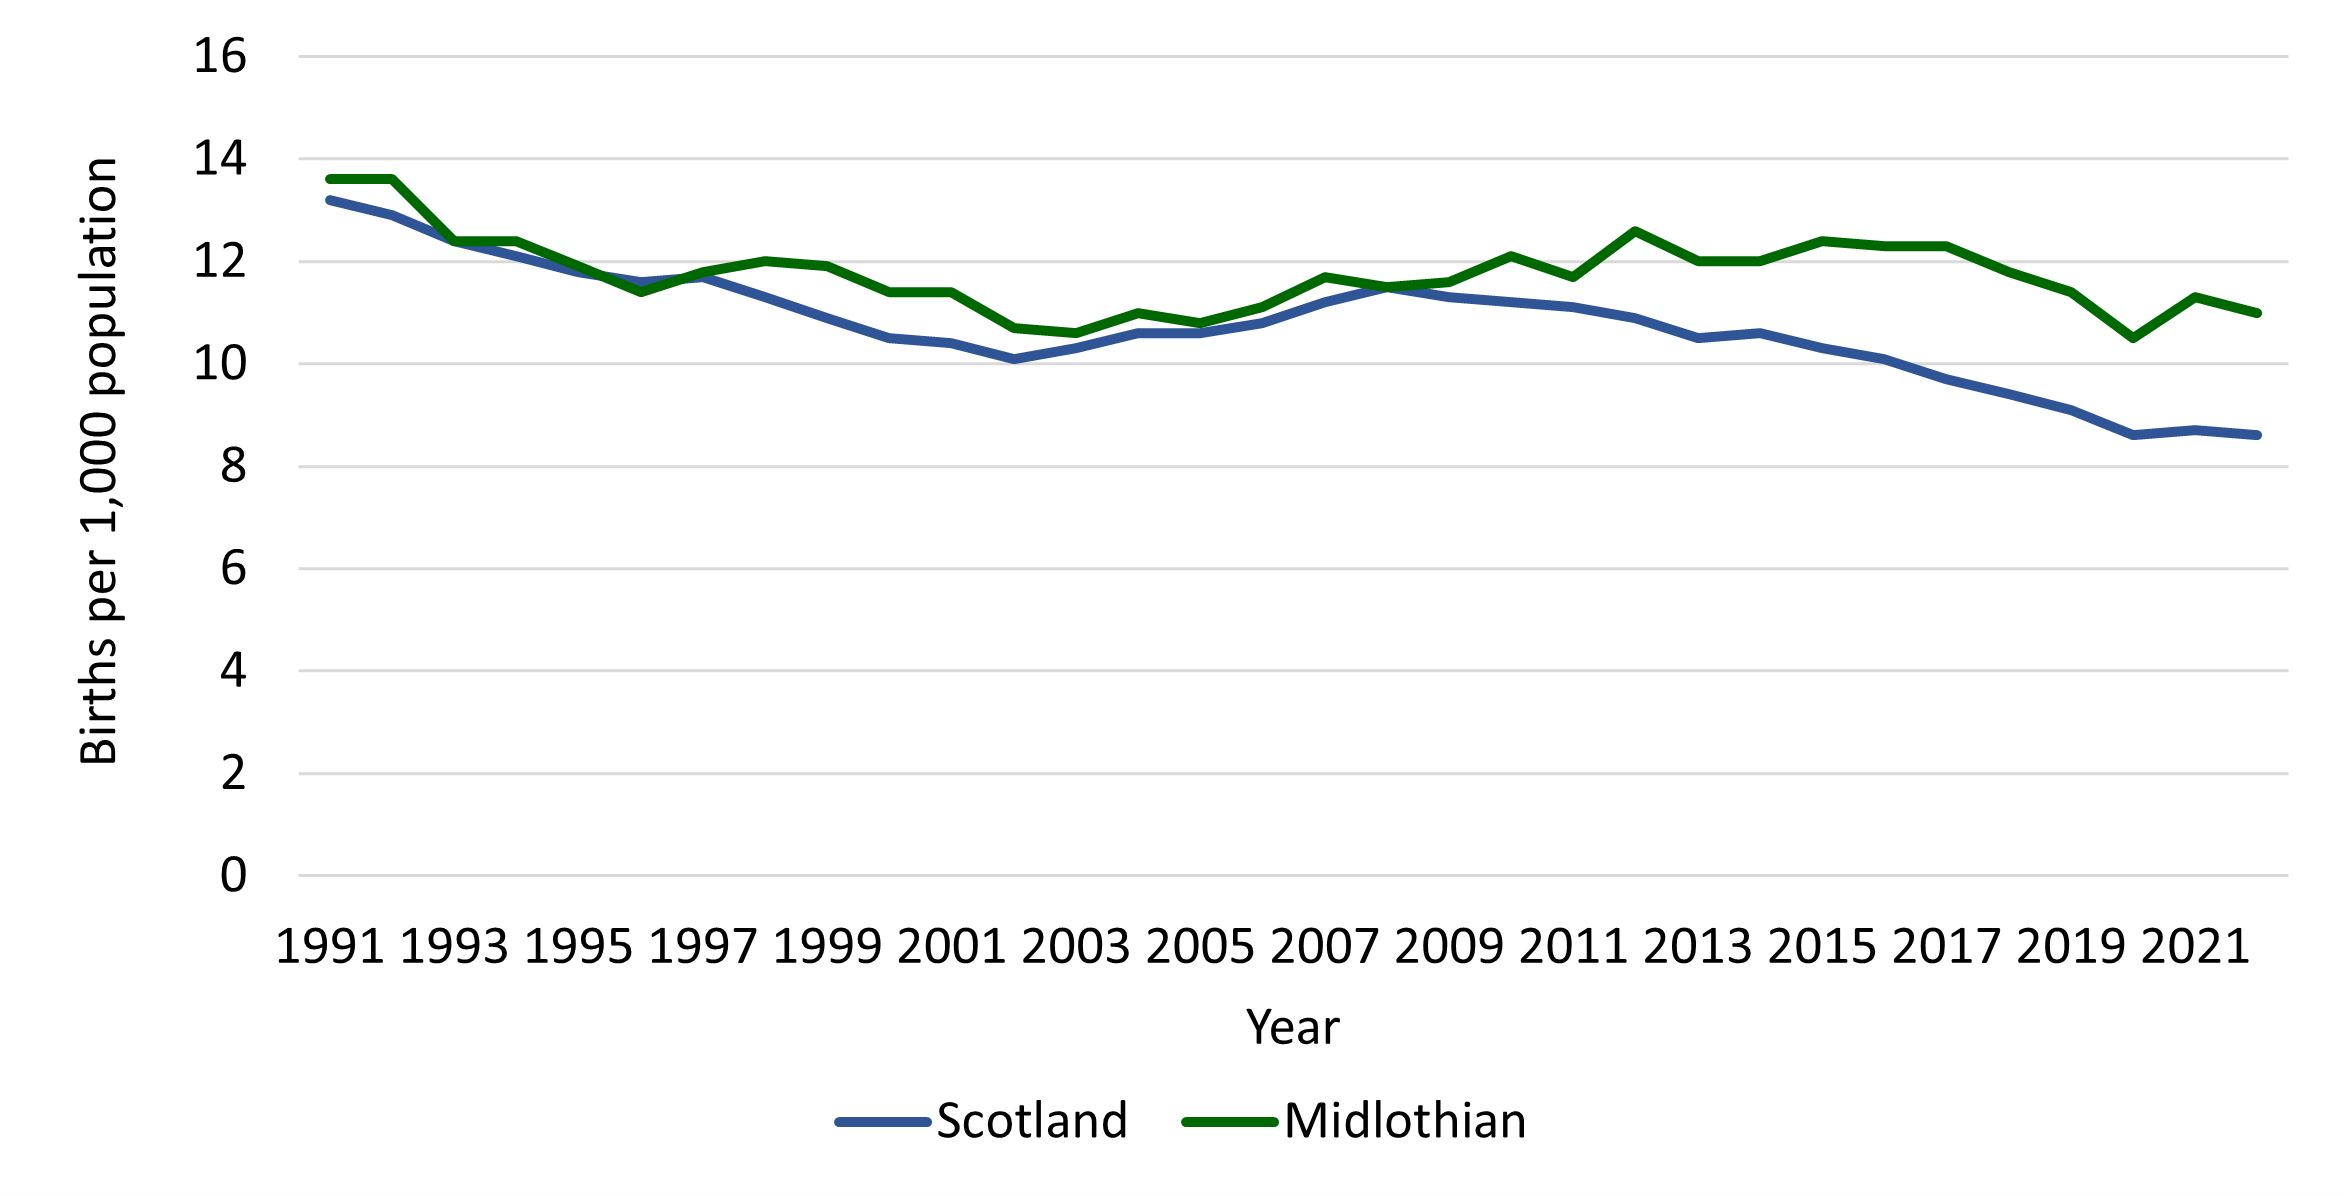
In 2021, there were 1,071 births in Midlothian (National Records of Scotland, 2023). This is an increase of 9.4% from 979 births in 2020.
In Midlothian, the standardised birth rate increased from 10.8 per 1,000 population in 2020 to 11.7 in 2021.
In comparison, the rate in Scotland overall increased from 8.6 to 8.7 (National Records of Scotland, 2023).
In 2021, Midlothian was the council area with the highest standardised birth rate (National Records of Scotland, 2023).
Page updated: February 2025